Models
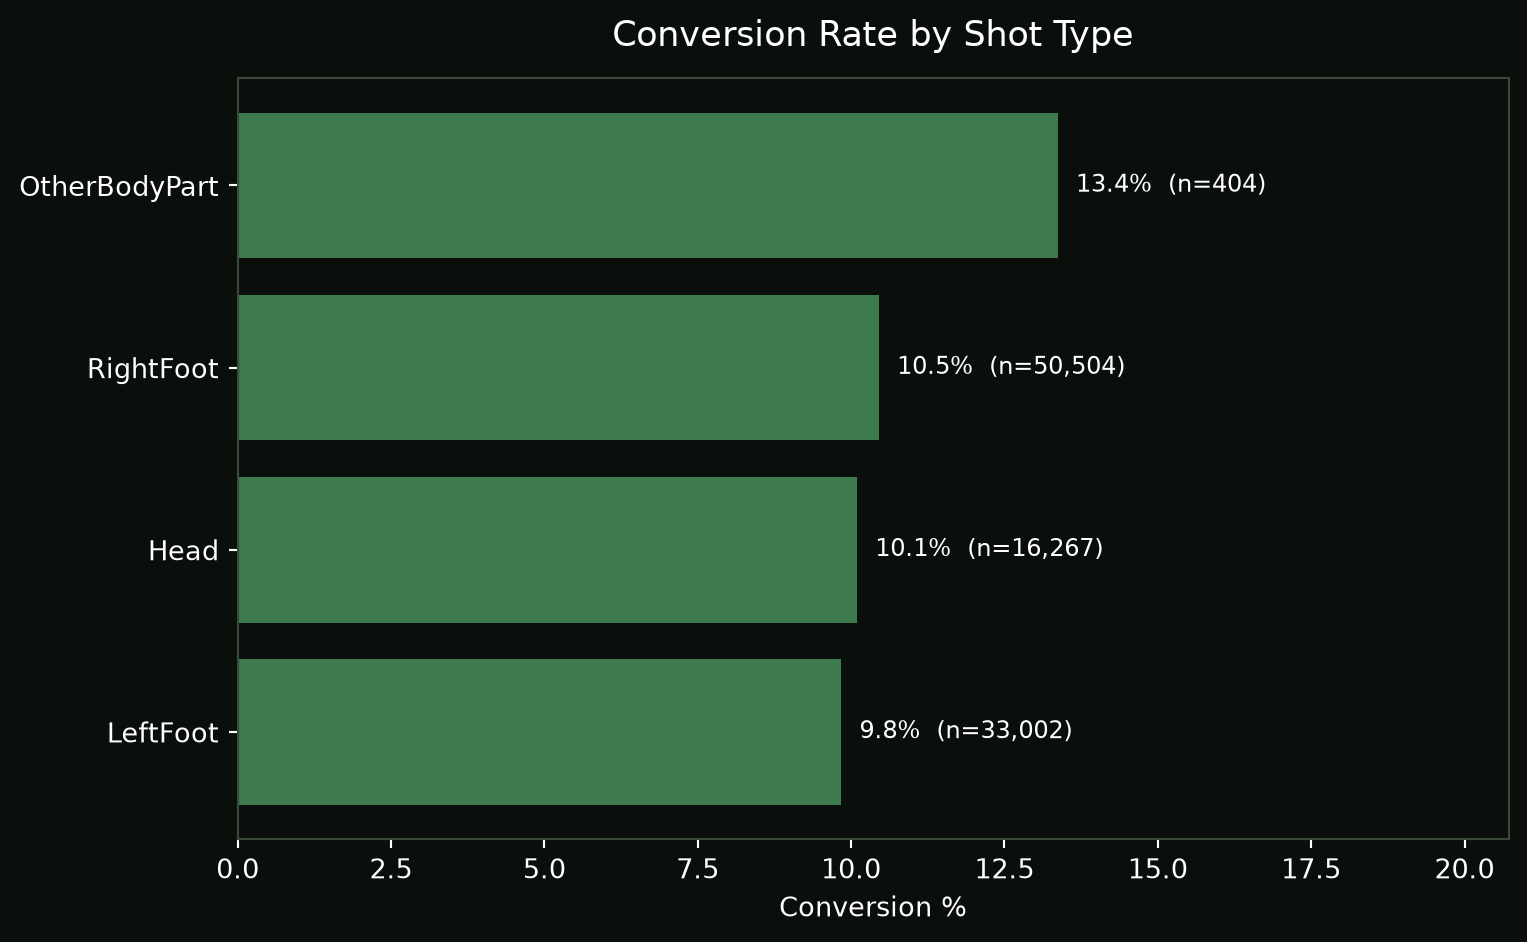
Right-footed shots have a 10.5%, with left foot and headers essentially tied at 10.0%. That gap is small between using your feet and using your head than a lot of people assume. The reason that this happens is that most headers happen in the six-yard box from crosses and set pieces, while foot shots span a wider range of distances and angles and are attempted more often. The “OtherBodyPart” category (13.4%) is a small sample (404 shots) — mostly scrambles and close-range instinctive finishes, so treat that one as noisy rather than meaningful.
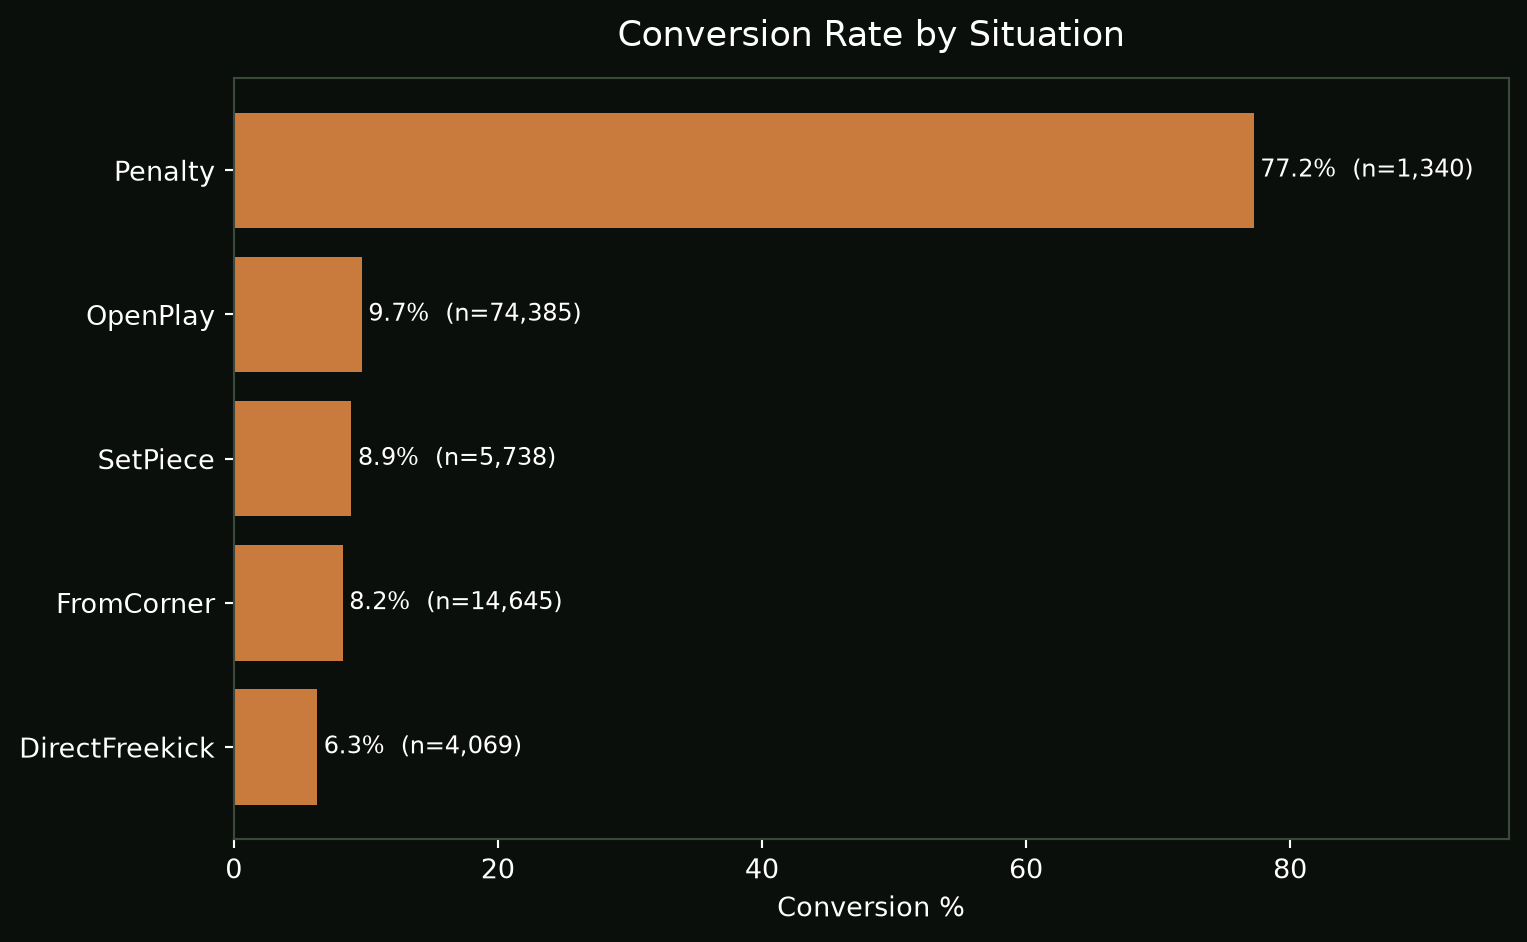
This is the widest spread in the whole dataset. Penalties at 77.2% are the outlier as they are essentially a free, undefended shot from 12 yards. What’s more interesting is the drop-off among the rest: open play (9.7%) clearly outperforms every organized set piece — corners (8.2%) and direct free kicks (6.3%) are the worst-converting situations by a wide margin. That’s the defensive-structure effect: set pieces are the one moment where the defending team gets to pack numbers into exactly the space the shot is coming from, so even good shooting positions get smothered.
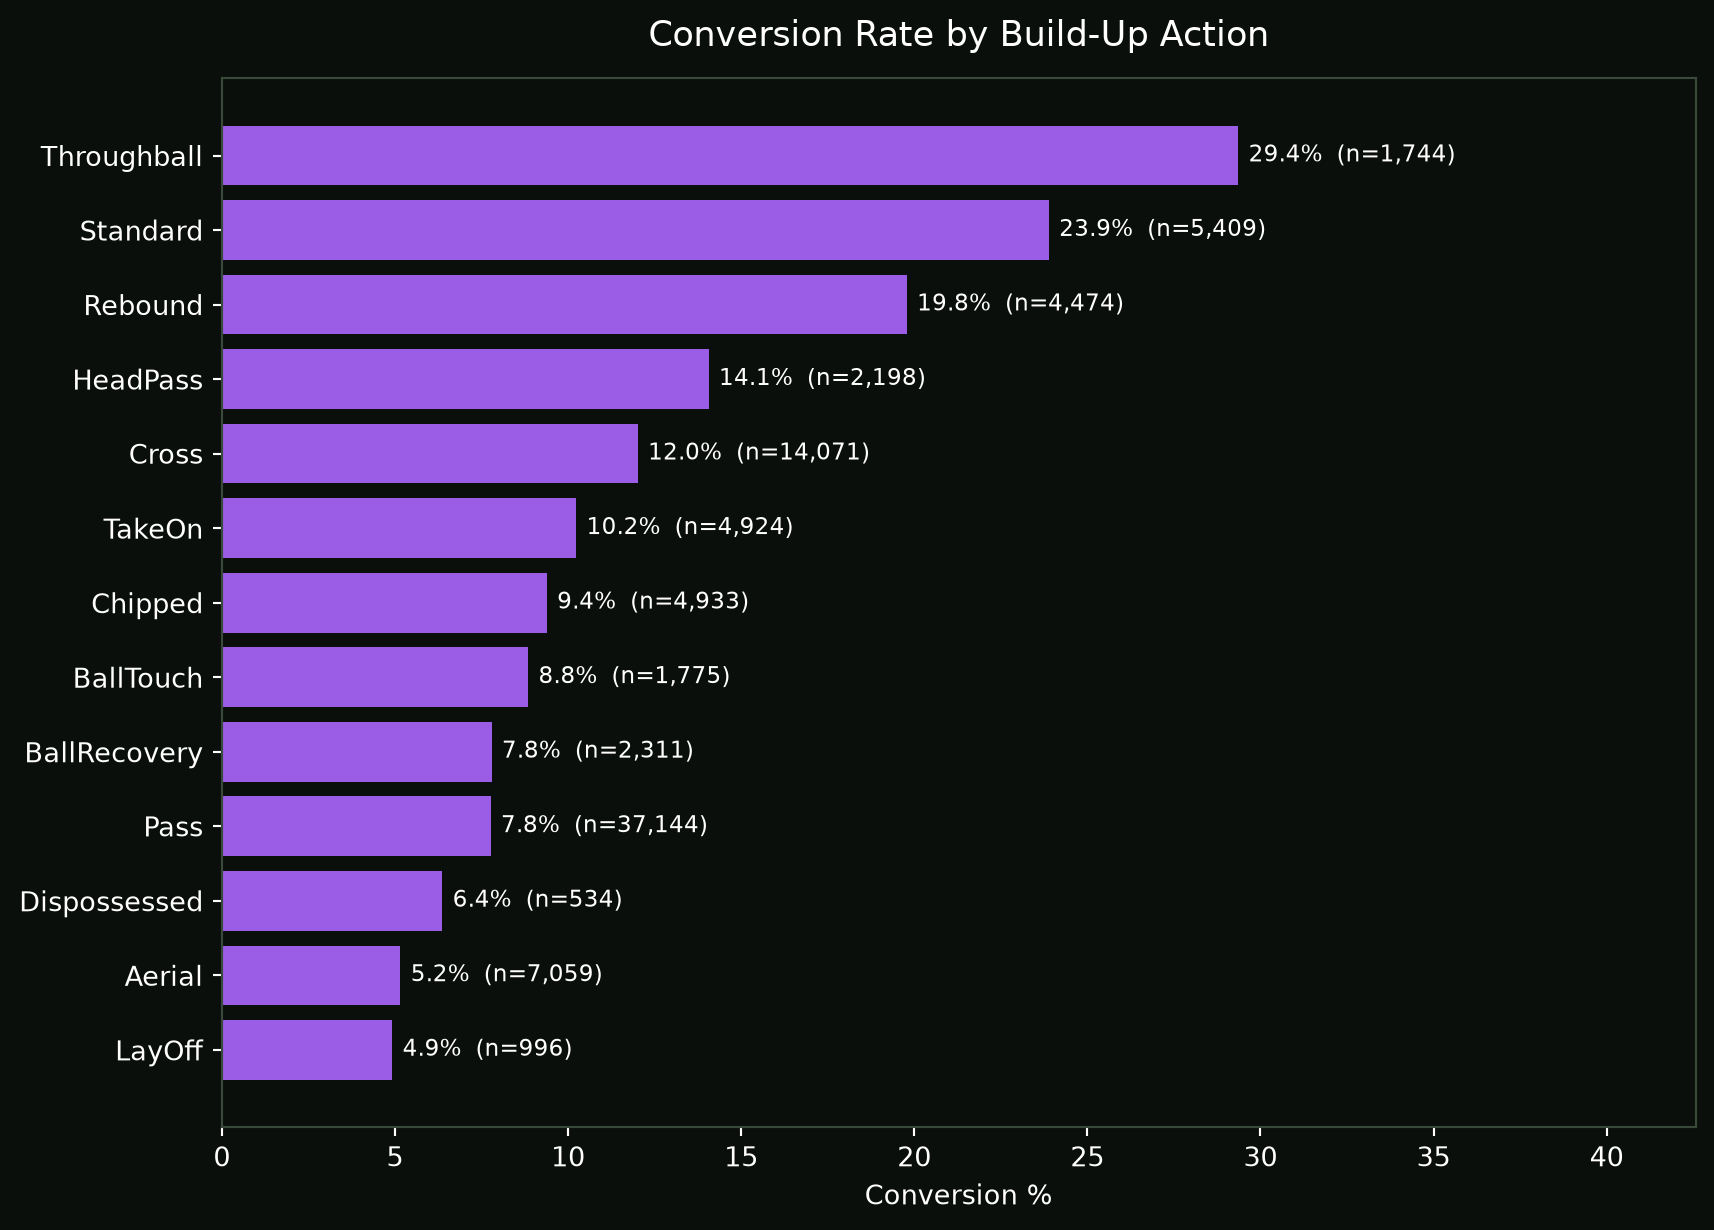
This is the standout chart of the three, and arguably the most useful one for understanding “what creates a good chance.” Through-balls are in a class of their own at 29.4%. That makes sense: a through-ball almost by definition means the last line of defense got beaten, so the shooter is facing a mostly-1 on 1 situation against the keeper. “Standard” (23.9%) and rebounds (19.8%) are next — rebounds convert well because the goalkeeper is already out of position. At the bottom, aerial duels (5.2%) and layoff (4.9%) are the worst — those are scrappy, contested, low-control situations, which tracks with intuition.
\[ \text{logit}(P(\text{Goal})) = -1.341 - 0.096 \cdot \text{Distance} + 0.032 \cdot \text{Angle} + 0.0005 \cdot \text{Minute} + 0.036 \cdot \text{Home} \] \[ - \, 0.041 \cdot \mathbb{1}[\text{LeftFoot}] - 0.956 \cdot \mathbb{1}[\text{Head}] - 0.789 \cdot \mathbb{1}[\text{Corner}] - 0.451 \cdot \mathbb{1}[\text{SetPiece}] + 0.784 \cdot \mathbb{1}[\text{FreeKick}] + 2.651 \cdot \mathbb{1}[\text{Penalty}] \]
| term | estimate | std_error | z_value | p_value | odds_ratio | ci_low | ci_high | sig | |
|---|---|---|---|---|---|---|---|---|---|
| 0 | Intercept | -1.5866 | 0.0783 | -20.2585 | 2.99e-91 | 0.2046 | 0.1755 | 0.2386 | *** |
| 1 | C(shotType)[T.LeftFoot] | -0.0110 | 0.0264 | -0.4158 | 0.6776 | 0.9891 | 0.9392 | 1.0416 | |
| 2 | C(shotType)[T.Head] | -1.0113 | 0.0361 | -28.0488 | 4.13e-173 | 0.3638 | 0.3389 | 0.3904 | *** |
| 3 | C(situation)[T.FromCorner] | -0.6895 | 0.0387 | -17.8241 | 4.60e-71 | 0.5018 | 0.4652 | 0.5413 | *** |
| 4 | C(situation)[T.SetPiece] | -0.4236 | 0.0541 | -7.8338 | 4.73e-15 | 0.6547 | 0.5888 | 0.7279 | *** |
| 5 | C(situation)[T.DirectFreekick] | 0.8284 | 0.0710 | 11.6631 | 1.97e-31 | 2.2897 | 1.9921 | 2.6317 | *** |
| 6 | C(situation)[T.Penalty] | 2.6947 | 0.0670 | 40.2066 | 0.00e+00 | 14.8016 | 12.9795 | 16.8794 | *** |
| 7 | distance | -0.0915 | 0.0030 | -30.0858 | 7.44e-199 | 0.9126 | 0.9072 | 0.9181 | *** |
| 8 | angle | 0.0345 | 0.0011 | 32.2553 | 2.97e-228 | 1.0351 | 1.0330 | 1.0373 | *** |
| 9 | minute | 0.0011 | 0.0004 | 2.4240 | 0.0154 | 1.0011 | 1.0002 | 1.0019 | * |
| 10 | home | 0.0017 | 0.0234 | 0.0745 | 0.9406 | 1.0017 | 0.9568 | 1.0488 |
Each column plays a specific role: term names the predictor, estimate is the raw coefficient in log-odds (mainly useful for its direction, positive or negative), std_error captures measurement precision, z_value is the estimate divided by its standard error, p_value gives the odds of seeing this effect by chance (below 0.05 counts as significant), odds_ratio (exp of the estimate) is the actual number worth reading since above 1 means higher scoring odds and below 1 means lower, ci_low/ci_high give the 95% confidence range for that odds ratio, and sig is just a quick visual flag for significance. As for the rows, intercept is only a baseline anchor and isn’t meaningful alone; distance (OR 0.909) shows each extra meter from goal cuts scoring odds by about 9%; angle (OR 1.033) shows each extra degree of visible goal mouth raises odds by about 3%; minute (p=0.25) and home (p=0.145) both show no real independent effect once other factors are controlled for; left foot is statistically identical to right foot; head (OR 0.384) reveals a genuine 62% scoring penalty for headers once distance and angle are held constant; from corner (OR 0.454) and set piece (OR 0.637) both convert far worse than open play because defenses are organized and set; direct free kick (OR 2.189) flips the raw-data story, showing free kicks actually outperform equivalent open-play shots once distance is accounted for; and penalty (OR 14.16) has by far the strongest, most certain effect, reflecting an unguarded close-range shot against just the goalkeeper.